On a whim, I decided to switch from InfluxDB to InfluxDB2. I really had no real reason for this upgrade but I wanted to try out the second version. I didn’t bother with an inplace upgrade because I didn’t care too much about the data I had so I just restarted from scratch. Spinning up the application was pretty straight-forward given the Helm chart that InfluxData provides. Since all my servers were configured with Ansible, a simple change in a single Telegraf config template meant switching the output destination was very easy.
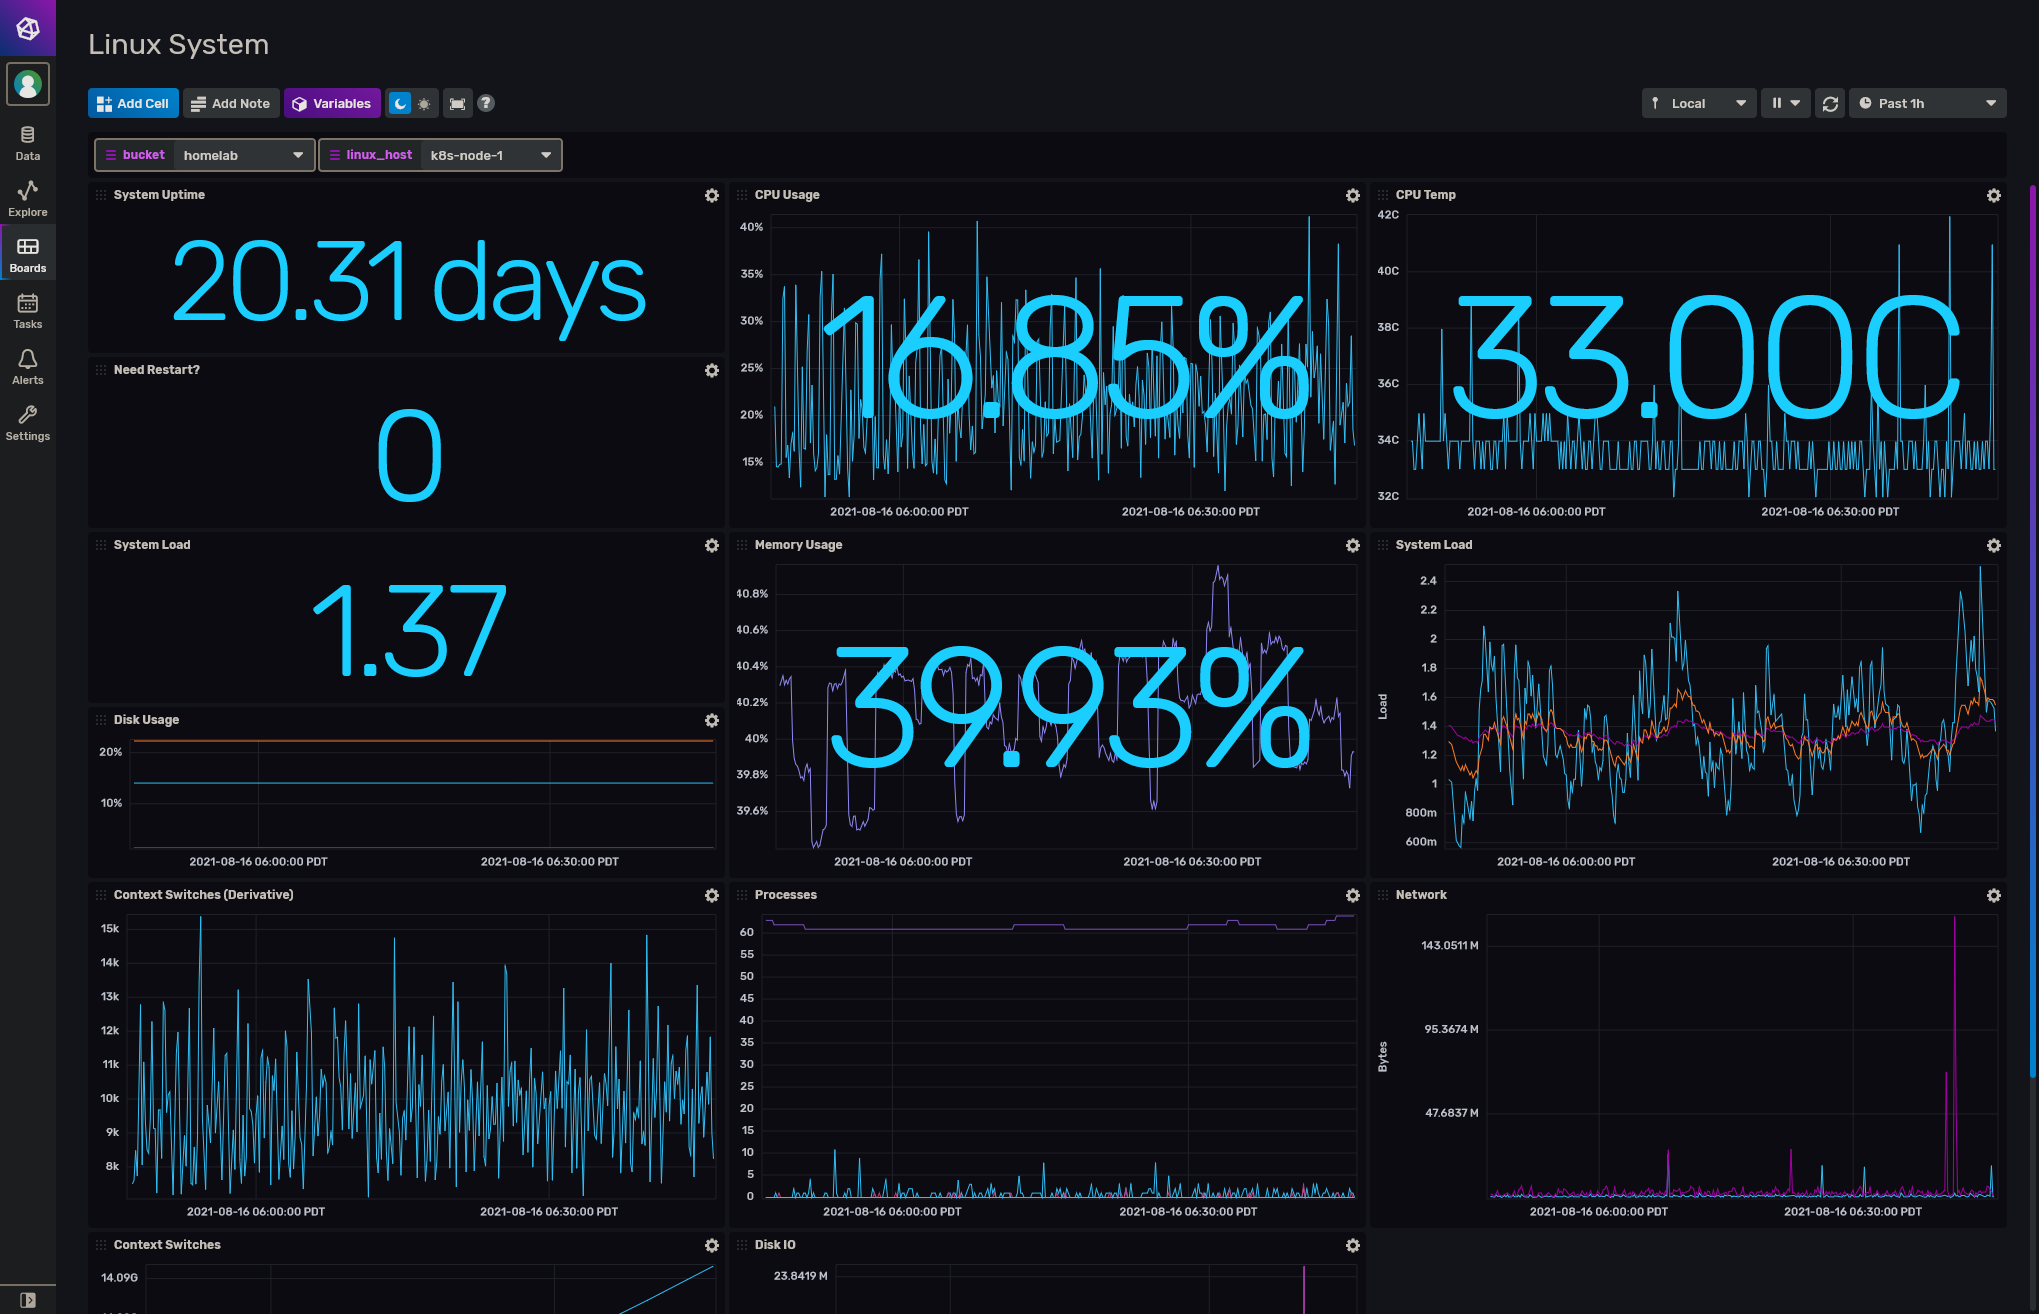
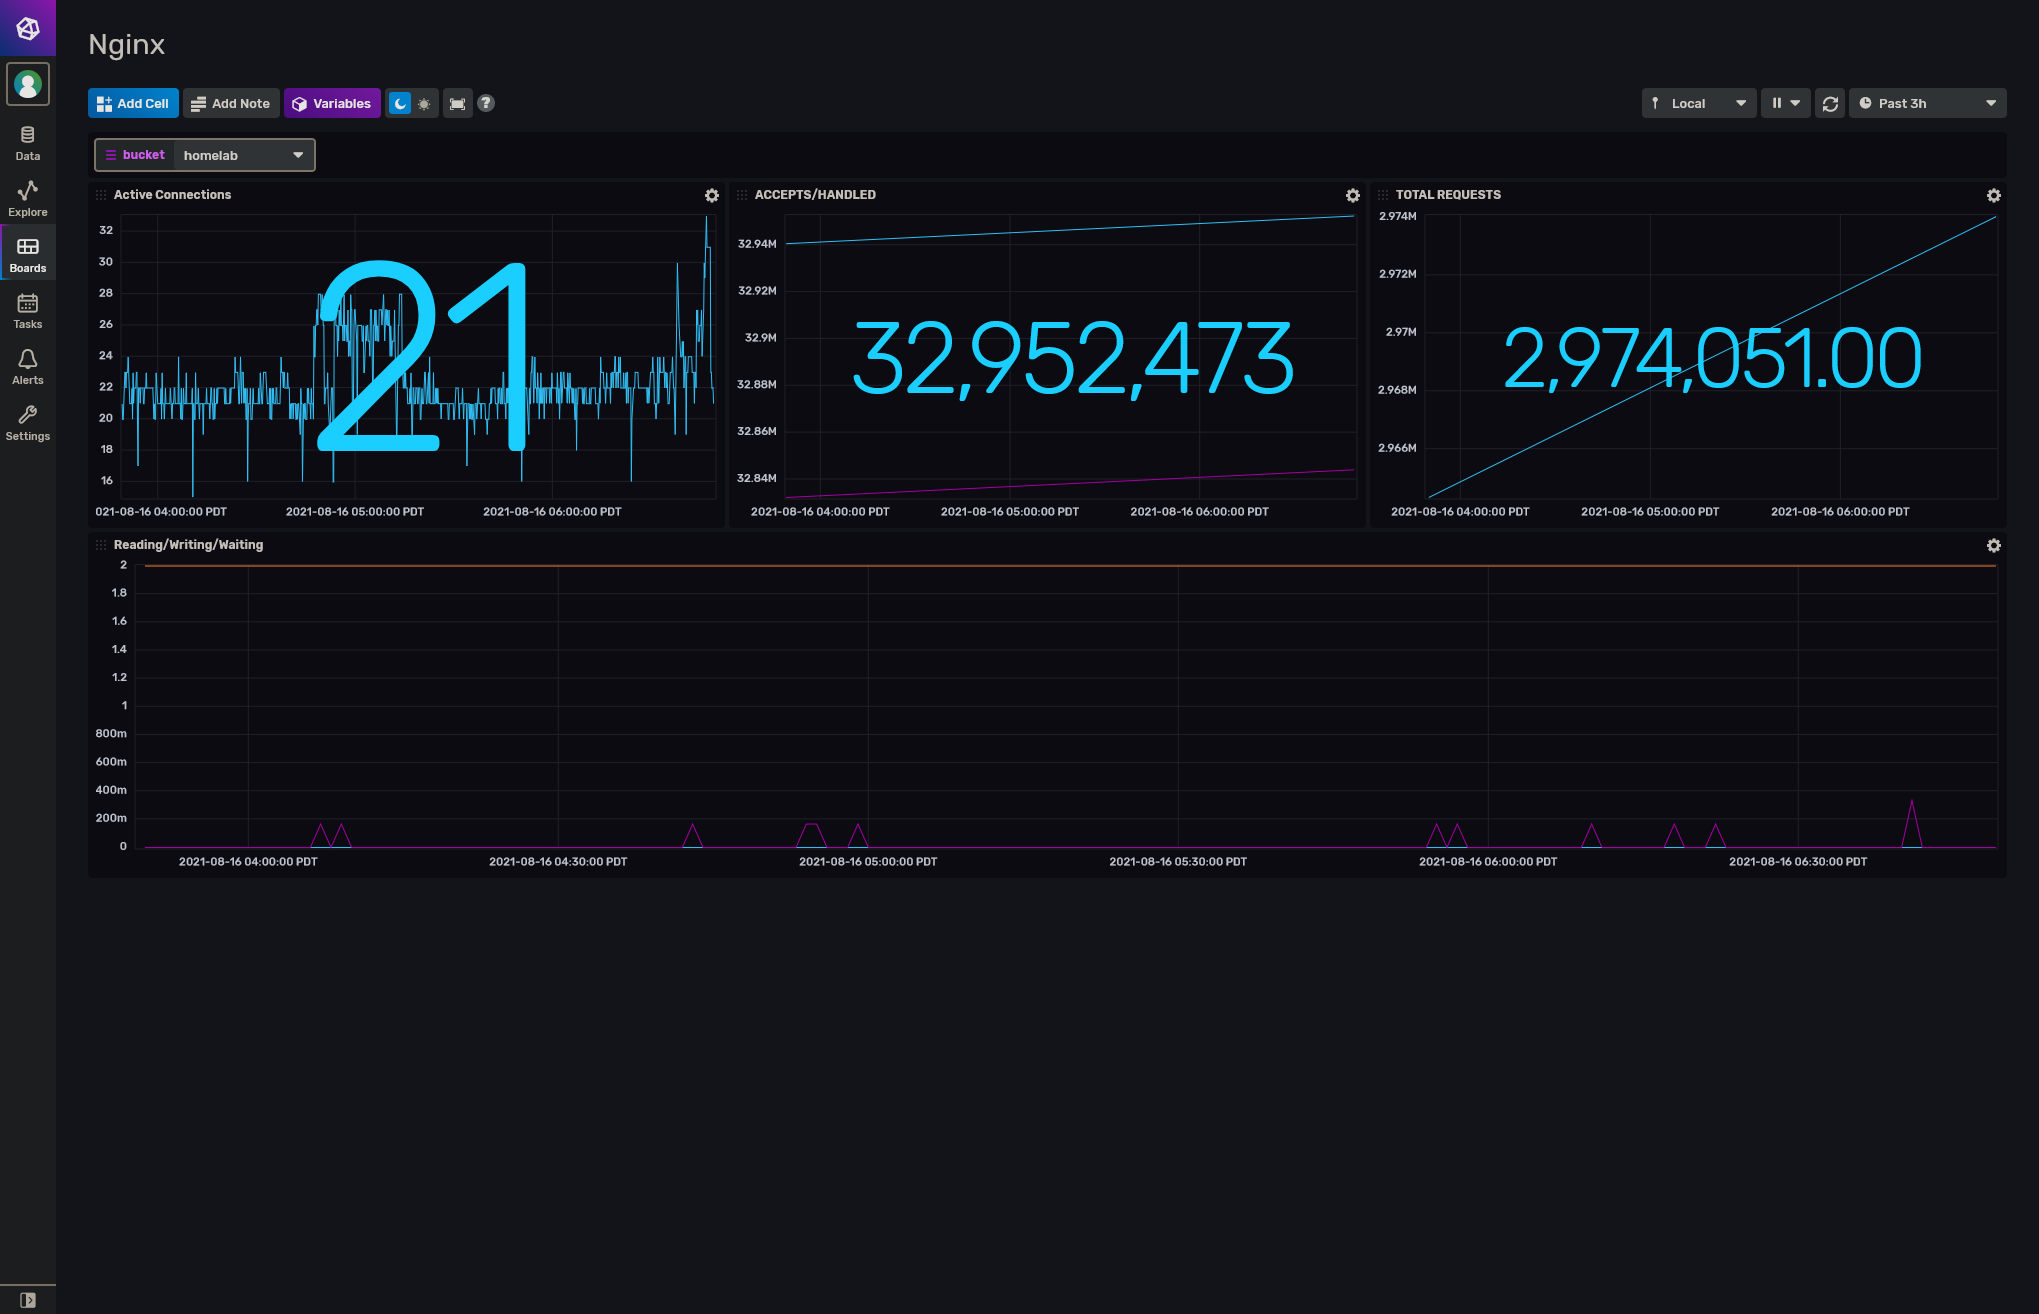
I really like the UI for InfluxDB2. Since it’s more than just a time-series database, it comes with a really nice UI where you can set up dashboards, learn, or just explore the data without the need of an external application like Grafana. Now despite the pretty user interface, I feel like it is lacking some nice to have features that Grafana has when it comes to dashboards. It does have alerting features, though, which I have not setup yet because I don’t really want to be pinged for my homelab.
Another thing that is handy is the templates you can browse and import. These templates are hosted on a Github repo and you can choose what to import from them. Such as buckets, variables, and dashboards, etc. I didn’t like using them straight up since I wanted to control what my bucket and variable names are. What I did do was simply take the dashboards and modified it to my liking. InfluxDB2 is backwards compatible with InfluxDB but there’s some minor hoops to jump through. So you could also still use Grafana to view your data, either treating InfluxDB2 as the first version or as is.
So was the upgrade worth it? Well, again I did it just for fun and nothing broke so: “sure”. I don’t think I would recommend doing this unless you really want to use the cool features that InfluxDB2 comes with.